To be successful
- Trust on This VSA. its modified not common
- Patience
- Risk Management
Im VSA we consider the
- Volume of the candle
- Spread of the candle. (size of the candle)
- Shape of the candle.
We need to study it

What is Tick in Volums
Tick volums e.g. 8.8k mean 8800 orders. it doesn’t include info that how many orders of buy/sell. there are some indicators in paid version like volume delta which actually tells how many buy or sell orders. We dont need that info in this VSA strategy
Adding volume info into candle shapes will help to escape traps.
Types of Volumes
- Ultra High Volume
- Current Highest Volume
- POI for trade considering conditions are met
- Very High Volums
- High Volumes
- close to Ultra high
- High Volumes
- Range/Normal
- Low
- Very Low
No need to see values. Just see volumes as we see buildings.
There are some patterns which help to identify the strength of the move.

SOS (Sign of Strength)
price is getting strong might be going upward
works well when trend is bullish
for best results in retracement of bullish trend
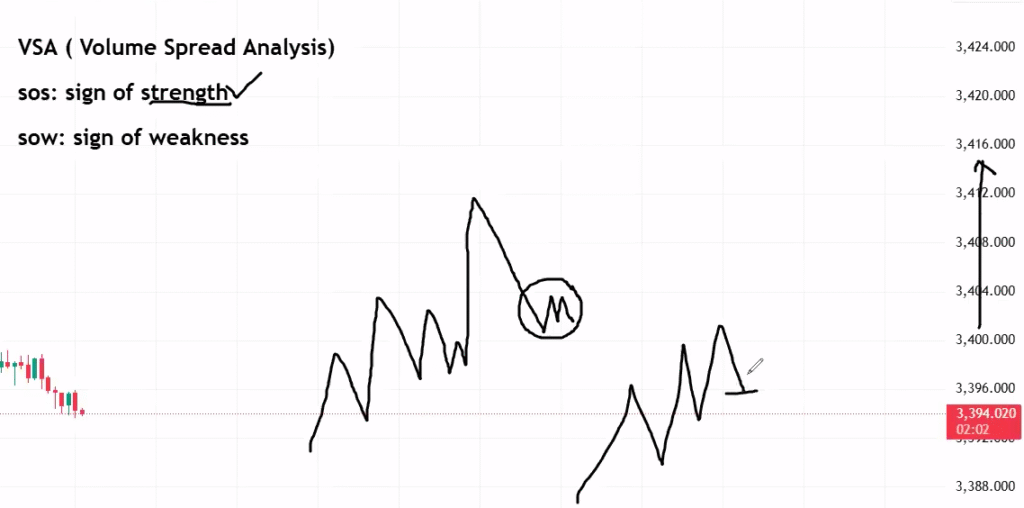
SOW (Sign of Weakness)
price is weakening. price may tend to go downward
works well when trend is bearish
for best result check sow in retracement of bearish trend
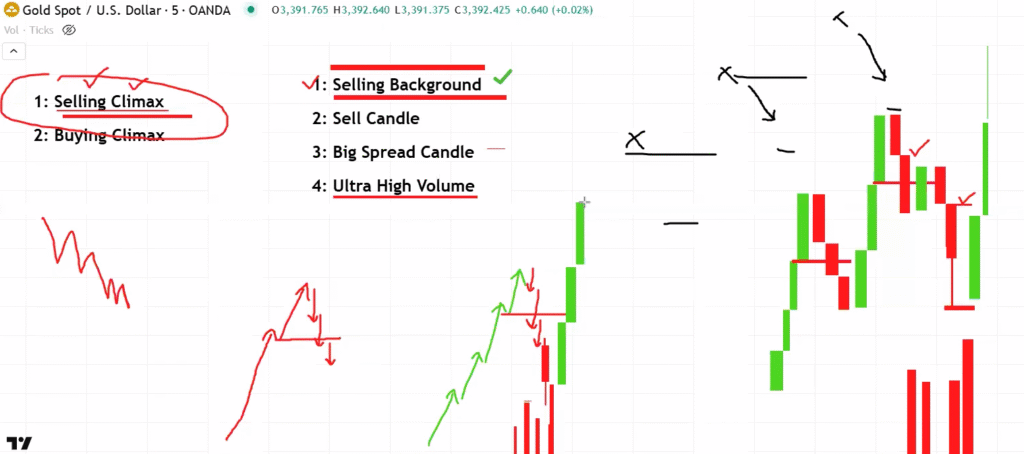
SOS Conditions
- Climatic Action Bar
- Selling Climax
- makes in bearish trend.
- ultra high volume in sell candle
- indicates the end of retracement
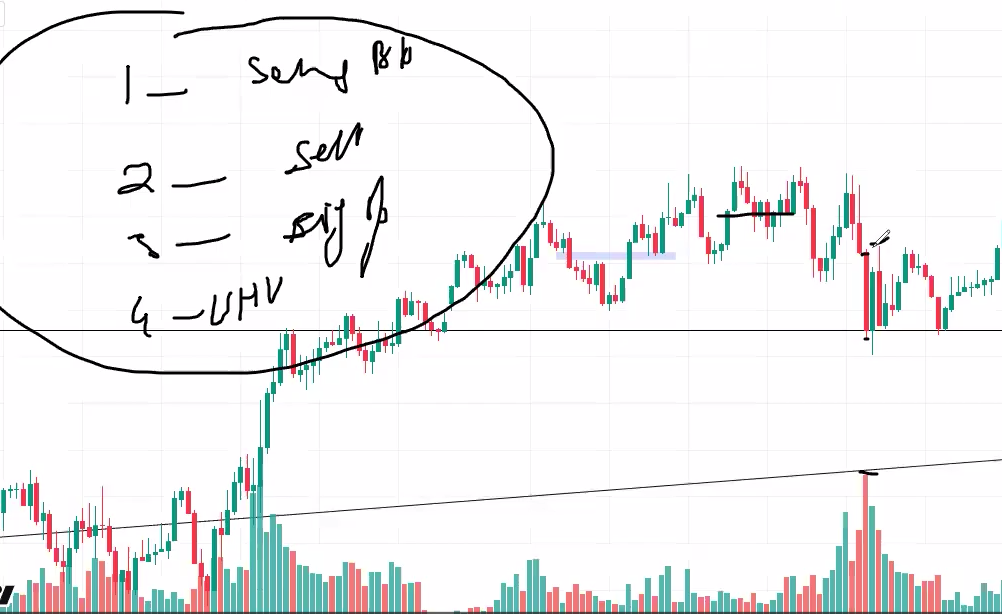
- Four Conditions
- 1. Selling background
- Do not check trend. even in retracement of a bullish trend there is a selling background
- 2. Sell candle
- 3. big spread candle (relaxed condition)
- 4. ultra high volume
- Note: in selling background buy candle should not have high volumes
- 1. Selling background
- Buying Climax
- makes in bullish trend
- ultra high volume in buy candle
- Selling Climax

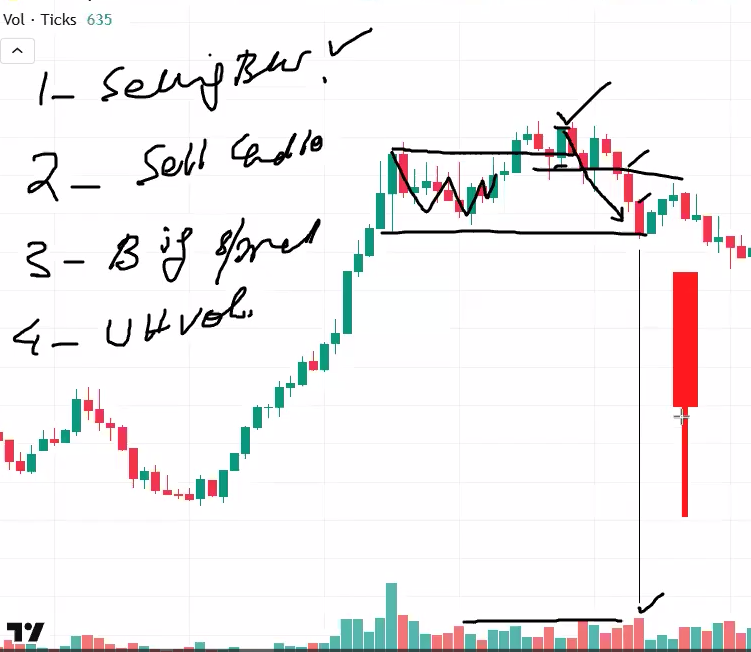
Selling Climax Candle should have a long lower wick

Big volume in selling candle means buying started