Support and Resistance
Here’s a clean, expanded, and complete version of your notes, written in a learning-oriented trading style (simple but not “too basic”), and aligned with market structure / SMC thinking. You can directly use this in your trading journal or course notes.
Support and Resistance
Support and Resistance is one of the most basic yet most misunderstood concepts in trading.
Many traders believe it “doesn’t work” because they use it mechanically. In reality, Support & Resistance is not about drawing random lines — it is about understanding market structure and price behavior.
Before learning advanced concepts like SMC, VSA, or Order Flow, we must understand Support & Resistance because it forms the foundation of structure.
What is Support?
Support is a price area (not a single line) from where price tends to rise.
- It is a zone where demand exceeds supply
- Buyers show interest
- Price finds difficulty in moving lower
👉 In simple words:
Where price goes up from = Support
What is Resistance?
Resistance is a price area from where price tends to fall.
- It is a zone where supply exceeds demand
- Sellers dominate
- Price struggles to move higher
👉 In simple words:
Where price comes down from = Resistance
Important Rule
Support and Resistance are zones, not exact price levels.
Price reacts in areas because large players (Smart Money) do not enter with one single order.
Types of Support and Resistance
1. Strong Support / Strong Resistance
A support or resistance becomes strong when:
- Price stays at that level for a long time
- Multiple candles respect the level
- Price reacts strongly (sharp move) from that area
- High volume activity is often seen
📌 Logic:
The longer price accumulates in one area, the more orders are built there.
Example:
- Price consolidates for days → breaks out strongly
- That level becomes strong support or resistance
2. Weak Support / Weak Resistance
A support or resistance is considered weak when:
- Price touches the level only once or twice
- Reaction is small or slow
- Very little consolidation
- Breaks easily when tested again
📌 Logic:
Less time = fewer orders = weaker level
3. Tested vs Untested Levels
- Untested level:
Price has not revisited the area → often stronger on first touch - Tested level:
Each test consumes orders → level becomes weaker over time
Support Becomes Resistance (Role Reversal)
One of the most powerful concepts in trading.
- When support breaks, it often becomes resistance
- When resistance breaks, it often becomes support
📌 This happens because:
- Buyers at support become trapped sellers after breakdown
- Sellers at resistance become trapped buyers after breakout
Support & Resistance in Market Structure
Support and Resistance help us identify:
- Higher Highs (HH)
- Higher Lows (HL)
- Lower Highs (LH)
- Lower Lows (LL)
These define:
- Uptrend
- Downtrend
- Range / Accumulation / Distribution
Common Mistakes Traders Make
❌ Drawing too many lines
❌ Treating S&R as exact price
❌ Ignoring trend and structure
❌ Trading every touch blindly
How Professionals Use Support & Resistance
✔ As areas of interest, not entry signals
✔ Combine with:
- Volume (VSA)
- Candlestick confirmation
- Break & retest
- Market structure
- Liquidity concepts
Support & Resistance alone is not a strategy — it is a framework.
Key Takeaway
- Support & Resistance is not outdated
- It is the language of the market
- Every advanced concept is built on structure
- Learn it deeply, not mechanically
at this stage

from where the price pumps is a support and from where it drops its resistance.


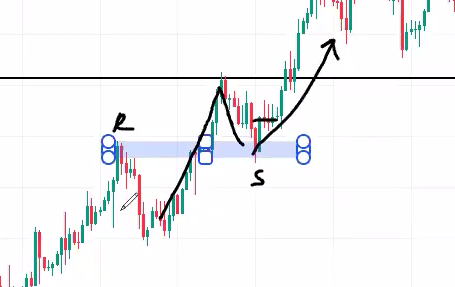
When price breaks above a resistance level, that resistance often turns into support.
This concept is called Resistance Becomes Support (RBS).
Why Does Resistance Become Support?
At resistance, sellers were previously strong
When price breaks above, it shows buyers have taken control
Sellers who sold at resistance become trapped
On a pullback, those trapped sellers may buy to exit
New buyers also enter at the old resistance level
📌 This creates demand at the previous resistance, turning it into support.
How to Identify Valid RBS
A resistance is more likely to become support if:
✔ Break happens with strong momentum
✔ Break is supported by volume expansion
✔ Price closes above resistance (not just a wick)
✔ Market structure shifts (BOS / HH formation)
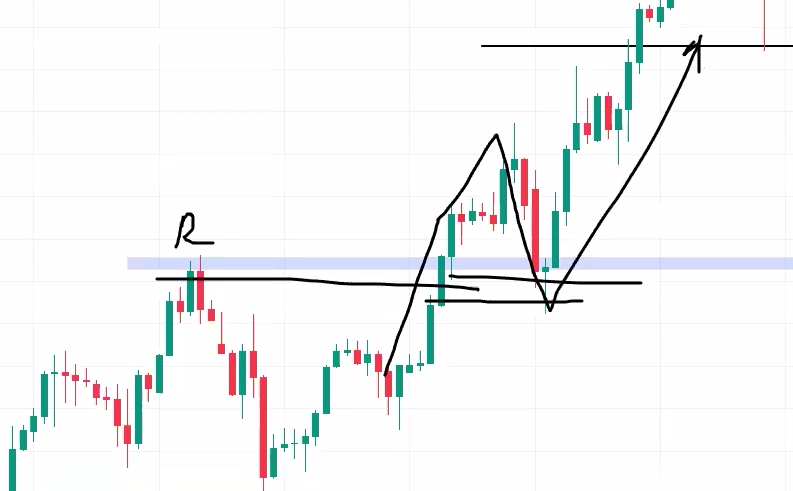
Retest of Resistance Turned Support
Price often returns to the broken resistance
This retest is called pullback or retest
If price holds and reacts bullish → RBS is confirmed
📌 Best trades often come after the retest, not on the breakout.
Failure of RBS
Resistance does not become support when:
❌ Break is weak or slow
❌ Break happens with low volume
❌ Price immediately falls back below the level
❌ No structure shift is formed
This indicates a false breakout.
RBS in Market Structure
RBS helps identify trend continuation
Confirms higher highs and higher lows
Acts as an area of interest for buying
Key Takeaway
Resistance does not magically become support —
it becomes support only when the market accepts higher prices.
ICT and VSA Will tell when to trade
Marking the support
Use rectangle to cover max points
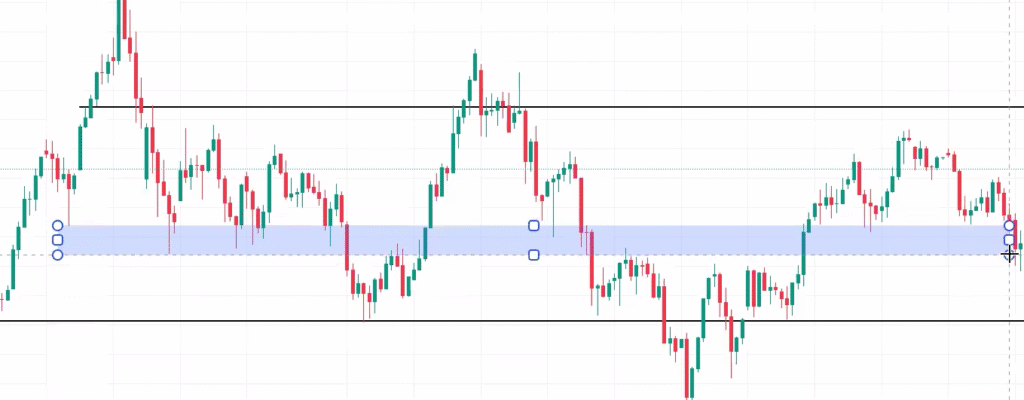
Support is not marked with a single line.
Professional traders mark support as a zone, usually by drawing a rectangle.
Drawing Support Using Lower Wicks
Traders identify the area where price rejected lower prices
This rejection is visible through multiple lower wicks
A rectangle is drawn to cover the maximum number of lower wicks
The body of candles is less important than wick rejection
📌 Logic:
Lower wicks show that sellers tried to push price down but buyers absorbed the selling pressure.
Key Rules for Marking Support
✔ Focus on repeated reactions, not one candle
✔ Cover the wick zone, not just candle closes
✔ More touches = stronger interest (until it gets over-tested)
✔ Best support forms after consolidation or accumulation
in this strategy retest is very important.
Got it 👍 — good catch, and your rule makes sense.
Here’s the corrected and refined version of your notes with low-volume momentum candle, written cleanly and logically (and aligned with VSA thinking):
How to Identify Support & Resistance Breakout
Not every break of resistance is a true breakout.
A valid breakout must show price acceptance above the level, not just temporary volatility.
Rules for a Valid Resistance Breakout (Your System)
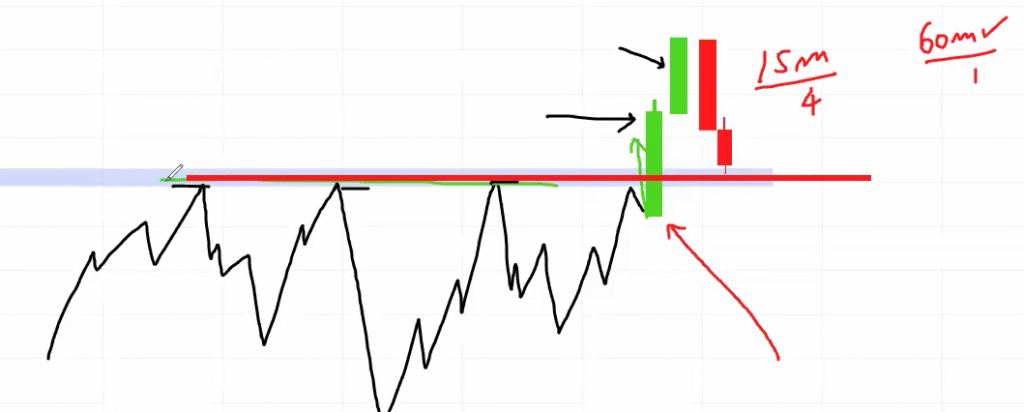
1. Momentum Candle Closing Above Resistance
For a valid breakout, the momentum candle must close above resistance.
Characteristics of Momentum Candle (as per your rules):
✔ Strong bullish candle (large real body)
✔ Low volume compared to recent candles
✔ No wick or very small wicks
✔ Clean price displacement above resistance
📌 VSA Logic:
Low volume on a wide bullish candle indicates lack of selling pressure.
Price moves up easily because supply is weak, not because of aggressive buying.
2. Low Volume is Acceptable — Context Matters
- Low volume during breakout means:
- Sellers are not interested at that level
- Resistance has been absorbed earlier
- This often happens after prior accumulation
📌 High volume is more important during tests and absorption, not always during the breakout candle itself.
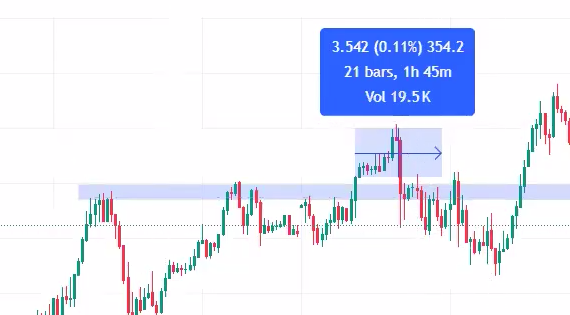
3. Price Acceptance Above Resistance
After breakout:
- Price must stay above resistance
- Minimum requirement: 4 candles closing above resistance
📌 Example:
If resistance is marked on a 5-minute chart, then at least four 5-minute candles should remain above resistance to confirm acceptance.
4. No Immediate Rejection
- No strong bearish candles immediately after breakout
- No long upper wicks showing supply entering
Immediate rejection = false breakout
Valid vs Fake Breakout (Your Rules)
Valid Breakout:
✔ Bullish momentum candle with low volume
✔ Clean close above resistance
✔ Multiple candle acceptance
✔ Smooth continuation or controlled pullback
Fake Breakout:
❌ High volume spike (possible distribution)
❌ Long upper wicks
❌ Failure to hold above resistance
❌ Immediate close back inside range
Best Trade Location After Breakout
- Avoid entering on the breakout candle
- Wait for Resistance Becomes Support (RBS)
- Look for:
- Low-volume pullback
- Bullish confirmation from support
Key Takeaway
In your system, a breakout is valid not because of high volume, but because there is no supply left to stop price.
4 candles must stay above resistance. even they can be red and green mix

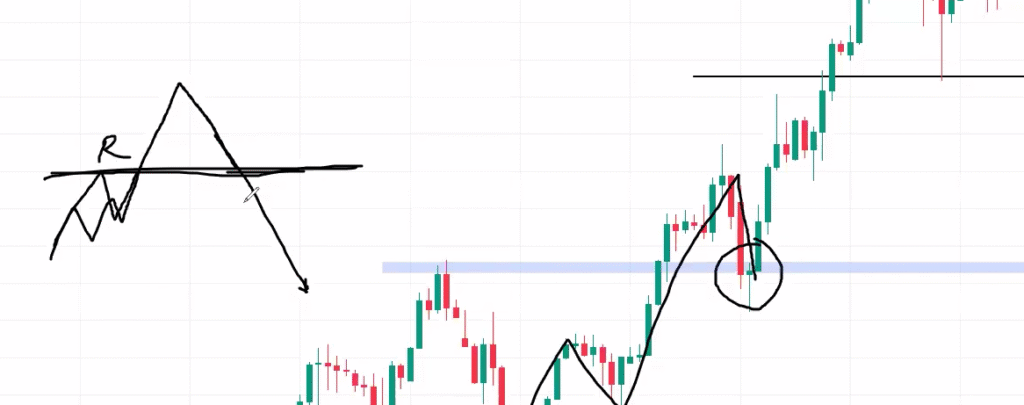
Fail retest example
Higher Time Frame Support and Resistance
Higher Time Frame (HTF) support and resistance levels work better and are more reliable than lower time frame levels.
Why Higher Time Frame Levels Are Stronger
- HTF levels are formed over more time
- They contain more orders and liquidity
- Institutional traders operate mainly on higher time frames
- Price respects HTF levels even on lower time frames
📌 Logic:
More time spent at a level = more participation = stronger reaction.
Time Frame Hierarchy
- Monthly / Weekly → Major structure
- Daily → Key trading zones
- H4 / H1 → Execution refinement
- M15 / M5 → Entry timing only
HTF defines where to trade.
LTF defines how to trade.